Overview
UpGuard provides a powerful platform to surface the cyber risks of your own and your vendors' assets. Users often deploy an array of solutions to detect and monitor different metrics and pipe metrics into a common logging and dashboarding solution, such as Splunk. This guide shows how to configure a Splunk integration from the UpGuard platform.
For this example, we will be logging a Splunk event when a new typosquatting domain becomes registered against one of my domains. Please use a different trigger throughout this guide to match your requirements.
Prerequisites
You will need a Splunk instance that allows HTTP based POST calls to be received from our UpGuard engine. You will also need to be an Account Admin in UpGuard to access the Integrations page.
Setting up Splunk to Accept Integration Events
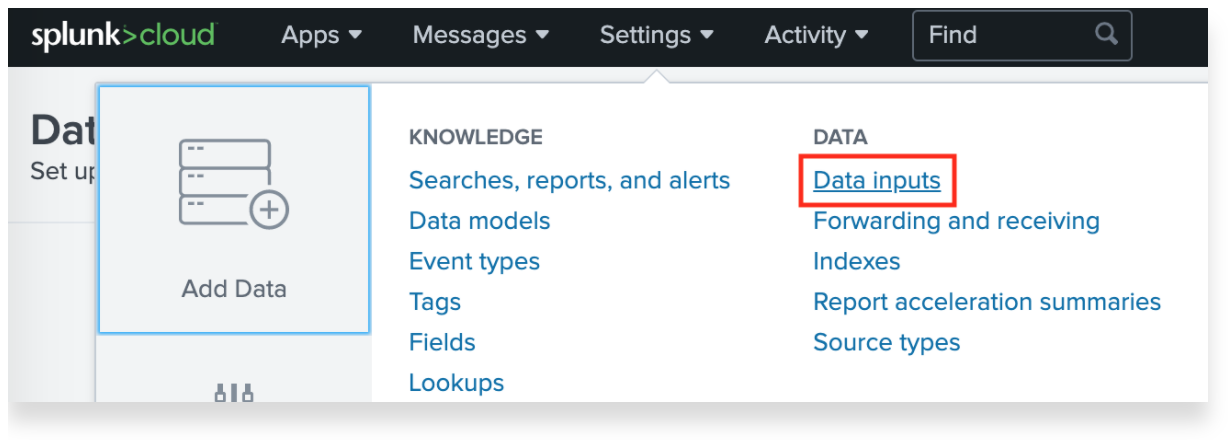
First we need to configure Splunk to accept HTTP based events. Navigate to Settings > Data > Data Inputs.
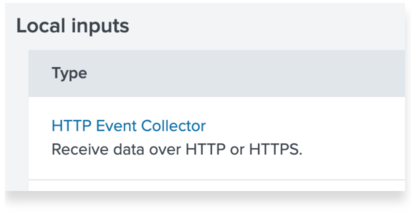
From the Local inputs section, select HTTP Event Collector.
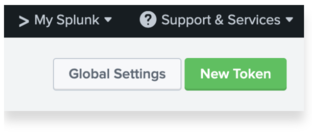
Here you will see a list of tokens enabled for potentially other feeds into Splunk. It’s a good idea to create a new token for the UpGuard Integration so that you have per-service access control in place. To create a new token, click the New token button.
Name the token something descriptive and optionally leave a short description outlining the use case of this HTTP data source.
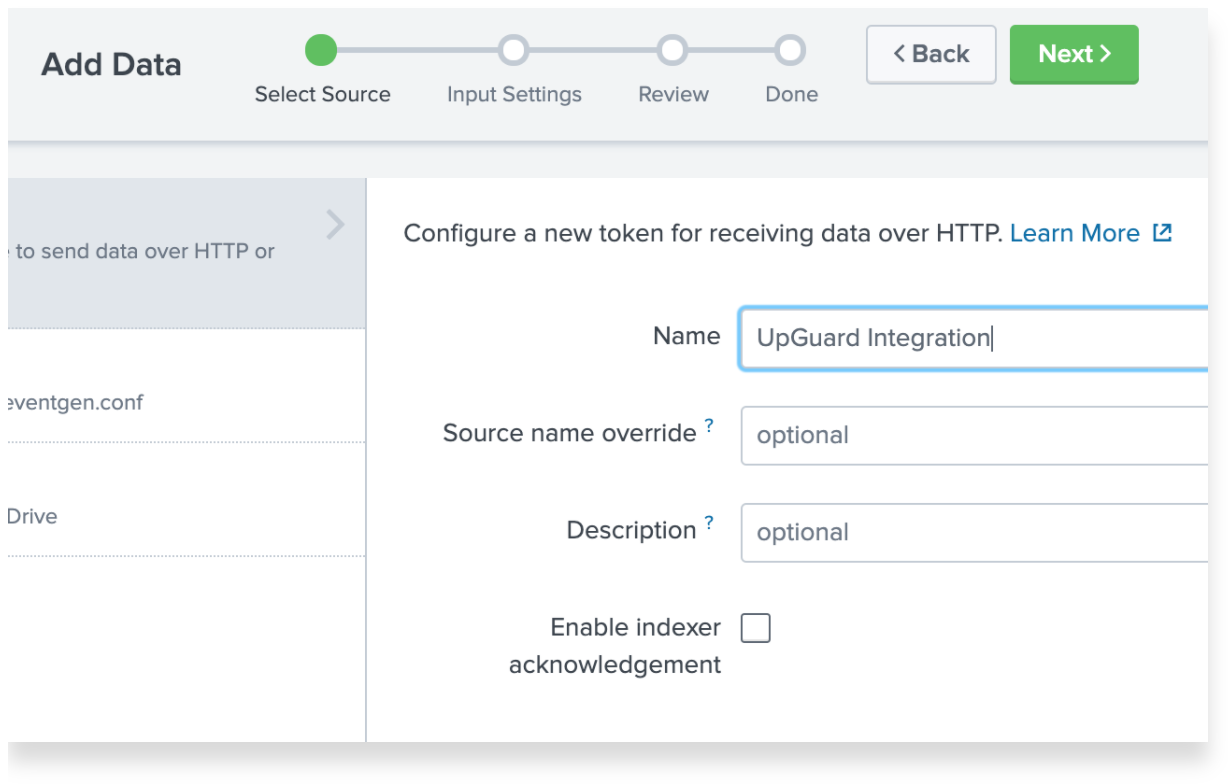
On the input settings screen, you can select Automatic for the data type to begin with and configure later once we have a complete integration set up on both the Splunk and UpGuard sides.
After reviewing the tokens settings you should be presented with a new token. You can also view the value for this token on the Data Inputs > HTTP Event Collector page.
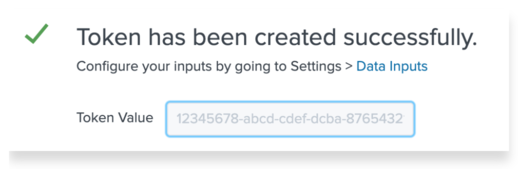
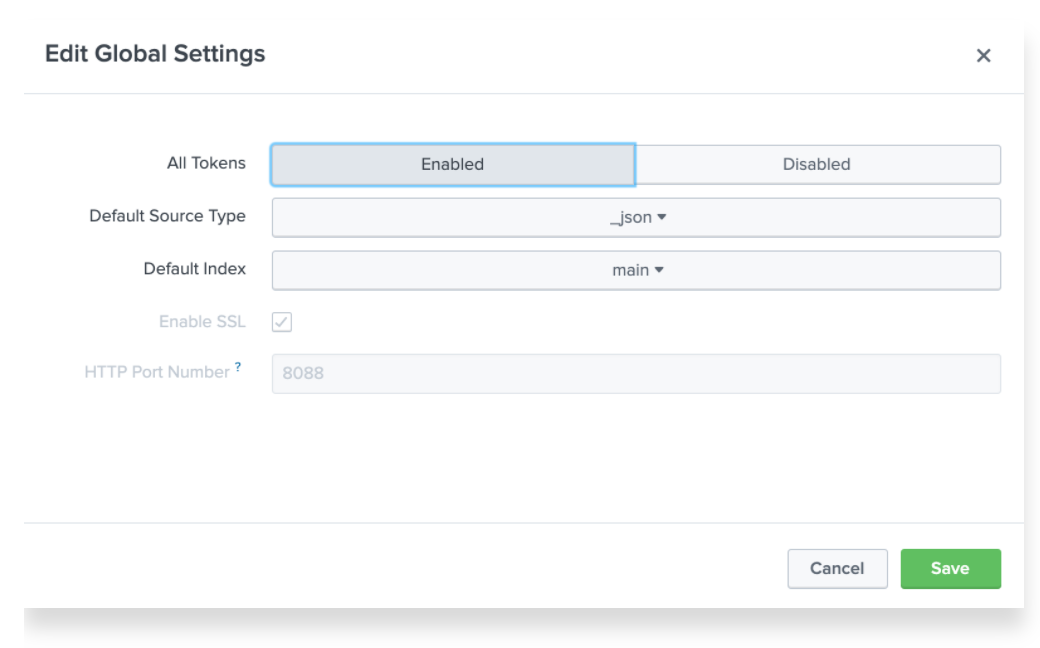
If this is the first time you are creating a HEC token, then you may need to enable the token in the Global Settings screen. To access Global Settings, click the Global Settings button next to the New Token button and then set All Tokens to Enabled and then click Save.
Make sure you have access to the HEC token generated here for the UpGuard configuration steps below.
Adding the Integration in UpGuard
- Click the Settings icon in UpGuard's top-right corner.
- Click the Integrations tab.
- Select + New Integration.
- Choose Webhook from the modal.
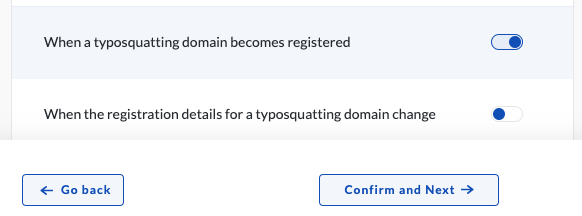
First, select the trigger you want to create events on. Here, we are going to select
When a typosquatting domain becomes registered. Click Confirm and Next.
Next, give your integration a descriptive name and enter the destination details of your integration. Here our Splunk server is hosted at the fictitious myserver.splunk.com:8088, please update your host and port accordingly. The Splunk Access Token you saved from the Splunk setup steps above should be entered against the "Authorization" header. Splunk auth keys are specified in a "Splunk 1234...." format. Click Confirm and Next to continue.
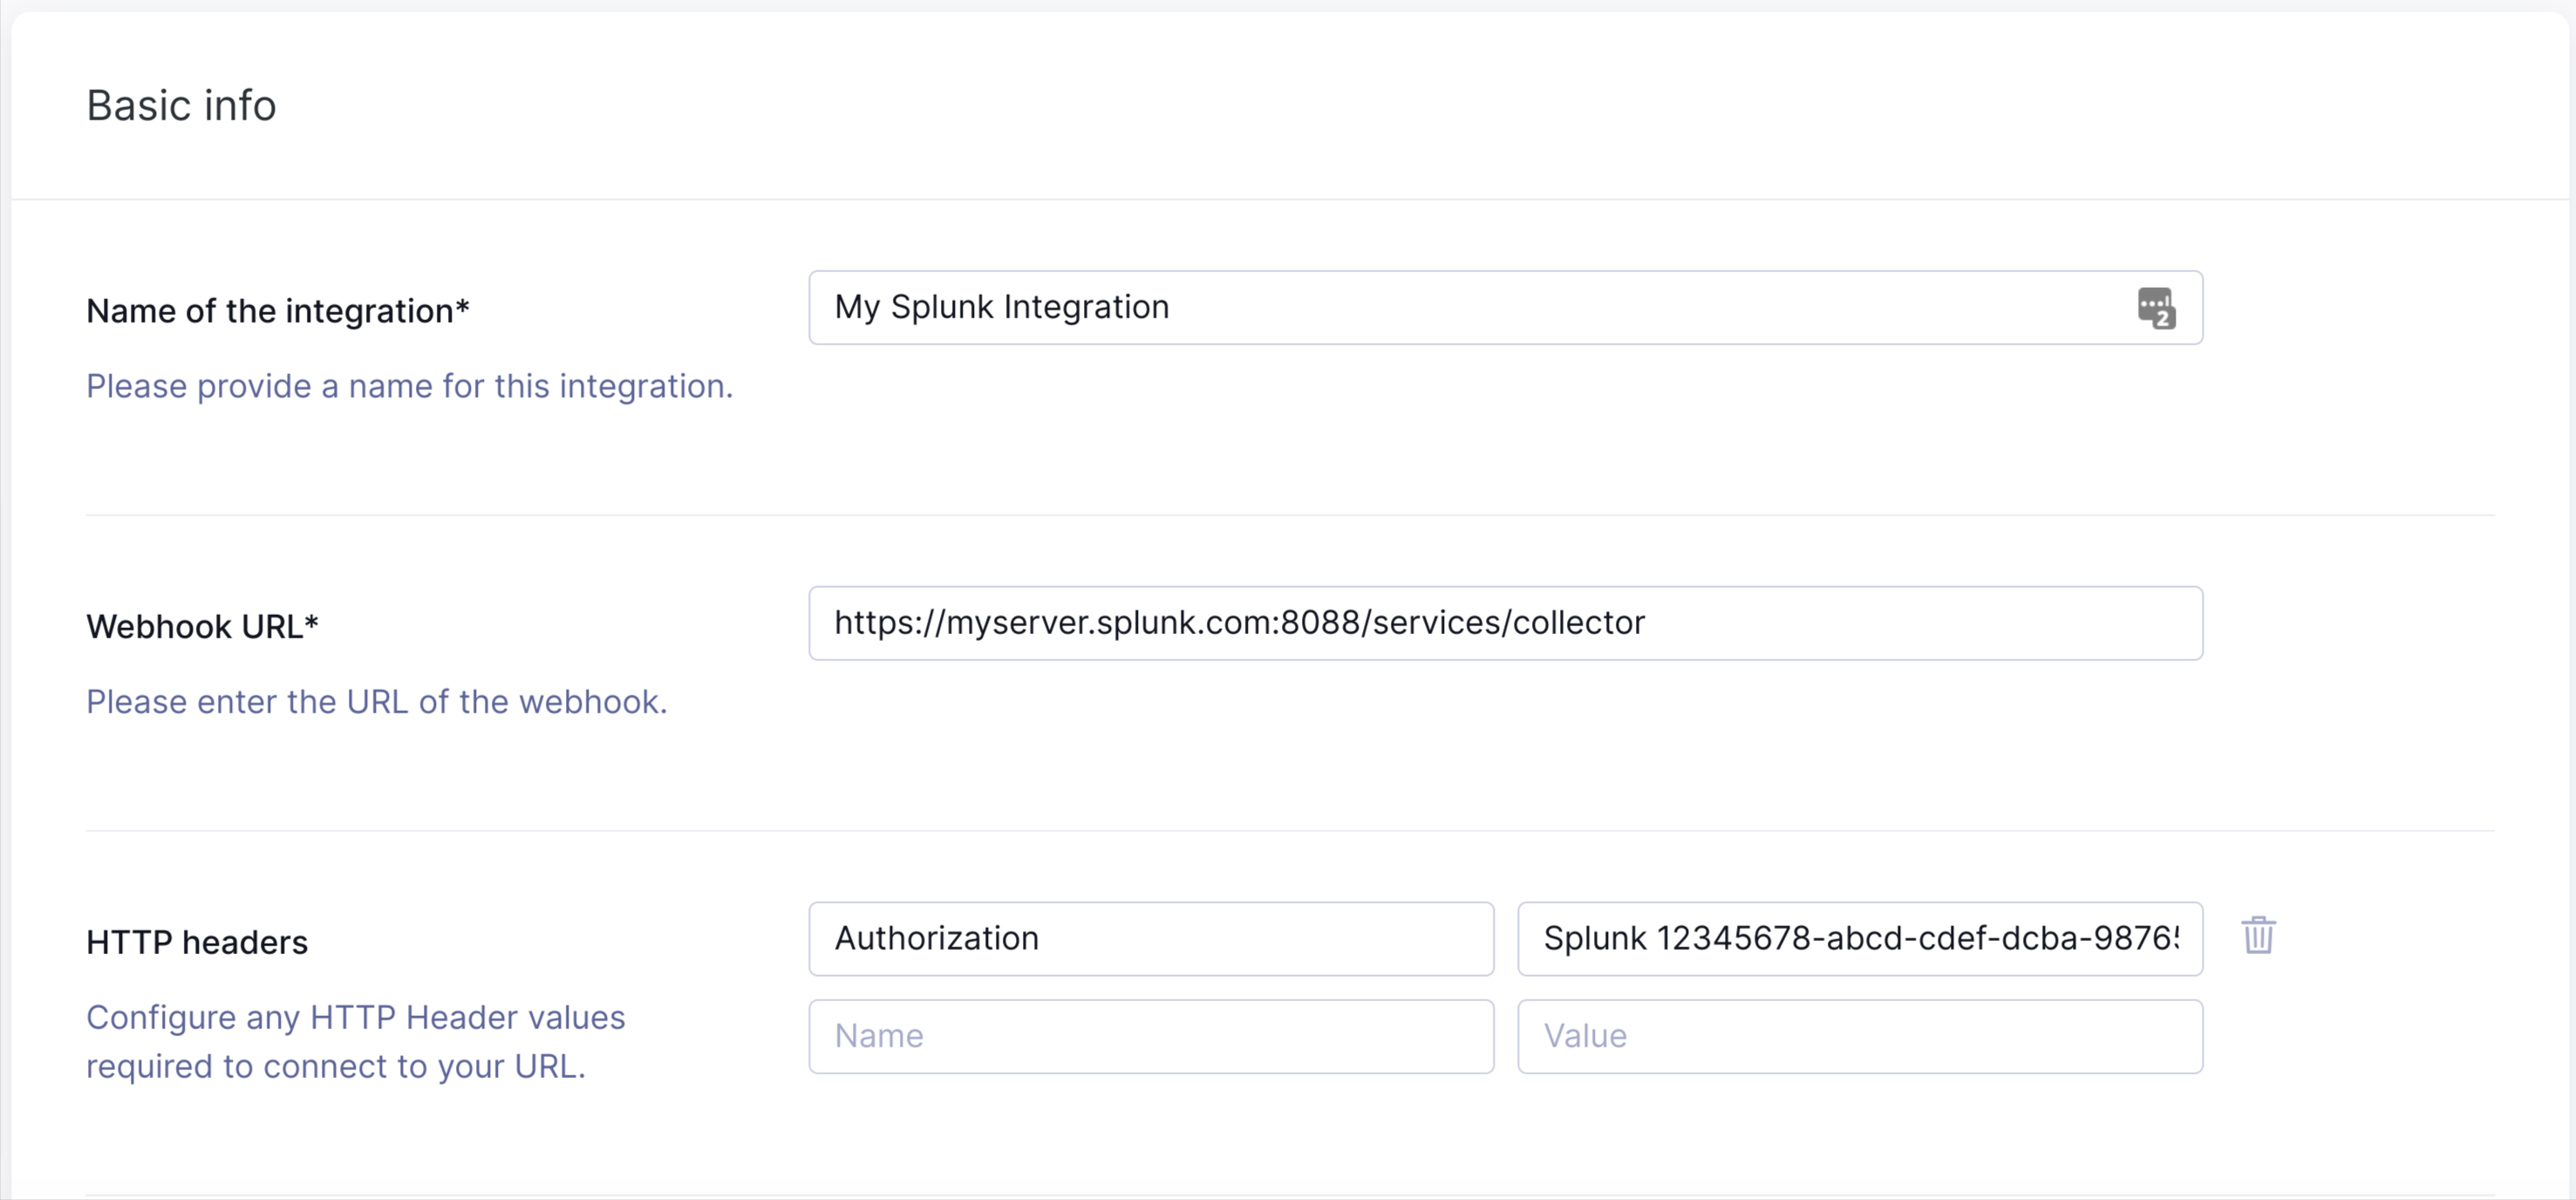
Note: The URL format can change from user to user based on your use case.
For Splunk Cloud customers, the standard HEC URL would be:
http-inputs-customer_stack
If you are using AWS Firehose, then you will have a second HEC URL:
https://http-inputs-firehose-customer_stack.splunkcloud.com/services/collector
Please note that Splunk Cloud customers do NOT need to specify port 8088, all HEC traffic goes over port 443 (standard SSL).
For customers running HEC on their own deployments or using the Splunk test drive instance, then port 8088 will need to be specified:
https://input-prd-uniqueid.cloud.splunk.com:8088/services/collector
You will need to figure out what your URL to receive webhooks is.
Lastly, we need to shape the request payload. The default payload for this trigger provides all possible fields that can be injected, so it's a good idea to keep this template at the top of the edit payload window while you construct your own custom payload.
For this trigger type, we want to log the following fields to Splunk:
-
Our domain that the typosquatted domain resembles
-
The fake/typo domain
-
A list of DNS A records that are associated with the typo domain
The following format lays out these pieces of information in a format that is acceptable by Splunk's event endpoint.
{
  "event": {
    "our_domain": "",
    "typo_domain": "",
    "a_records": [

    ],
    "type": "UpGuard-CyberRisk-"
  }
}
This should interpolate to a JSON payload at event time looking like this:
{
  "event": {
    "out_domain": "upguard.com",
    "typo_domain": "upgaard.com",
    "a_records": ["1.2.3.4", "5.6.7.8"],
    "type": "UpGuard-CyberRisk-TyposquatRegistered"
  }
}
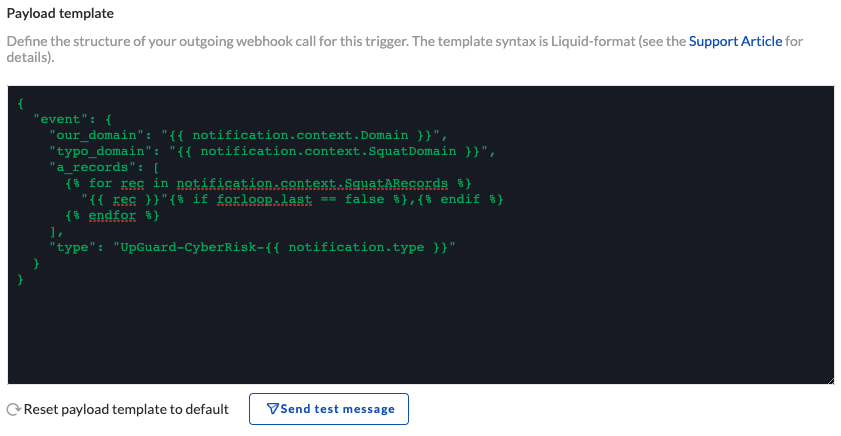
Click the Send test message button to perform a live test against your instance of Splunk. Click Confirm and Next when you are happy with your payload and it appears in Splunk.
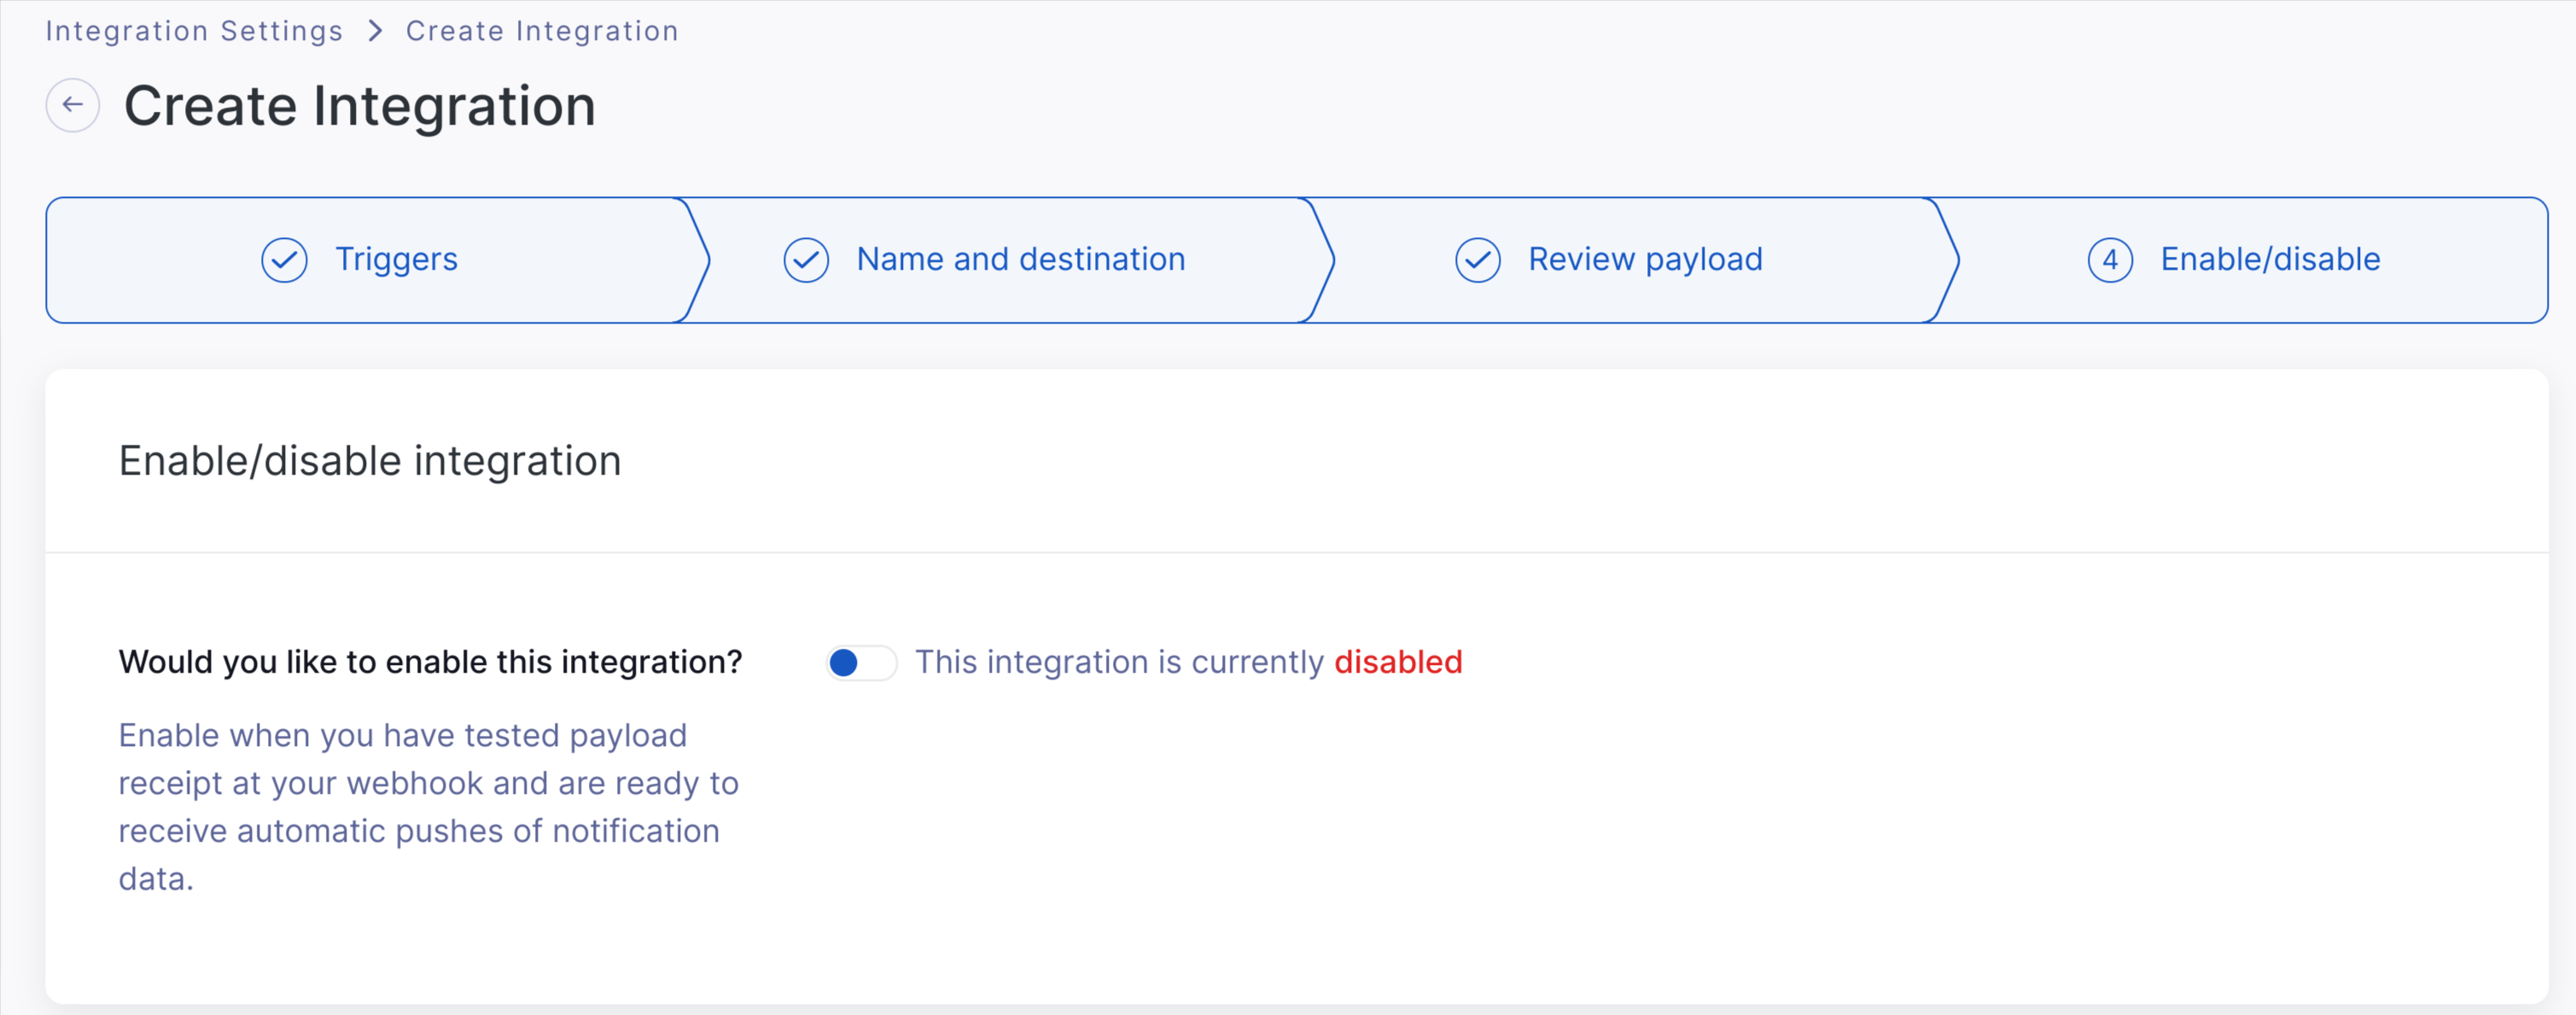
Now that you have configured your integration, you will need to enable it. Click the Enable this integration toggle to enable the integration, then click Finish.
You should now see your new integration in the list of integrations. You can go back at any time and edit any of the settings by clicking the pencil icon to the right of the integration.
What Next?
Many of the triggers available are fixed types of events, such as when a new a new Data Leak is published, or when a new message is posted on a remediation request. There are other types that can be configured, such as when your score drops by or below a certain value, or when your vendor scores increase above a threshold. These can be configured via the Notifications page.