You can use your risk profile to see the changes in your attack surface over time, as far back as a year ago. The changes captured include scoring algorithm improvements, domains added or removed, and risks introduced or resolved.
Firstly, log in and head to your risk profile by clicking here or navigating to Breach Risk > Risk Profile.
You can select the timeframe you want to view from either 1 month, 3 months, or 12 months.

You can also choose to display either the internal rating or the public rating.

Select a specific date by clicking on the graph, or drag to pick a date range. In the example below, the period Jan 23 to Feb 5, 2025 has been selected. As you can see, a blue box indicates you are in the 'changes view' and the selected timeframe is darker than the rest of the graph.
To view the changes that have happened in this timeframe, select View Changes.

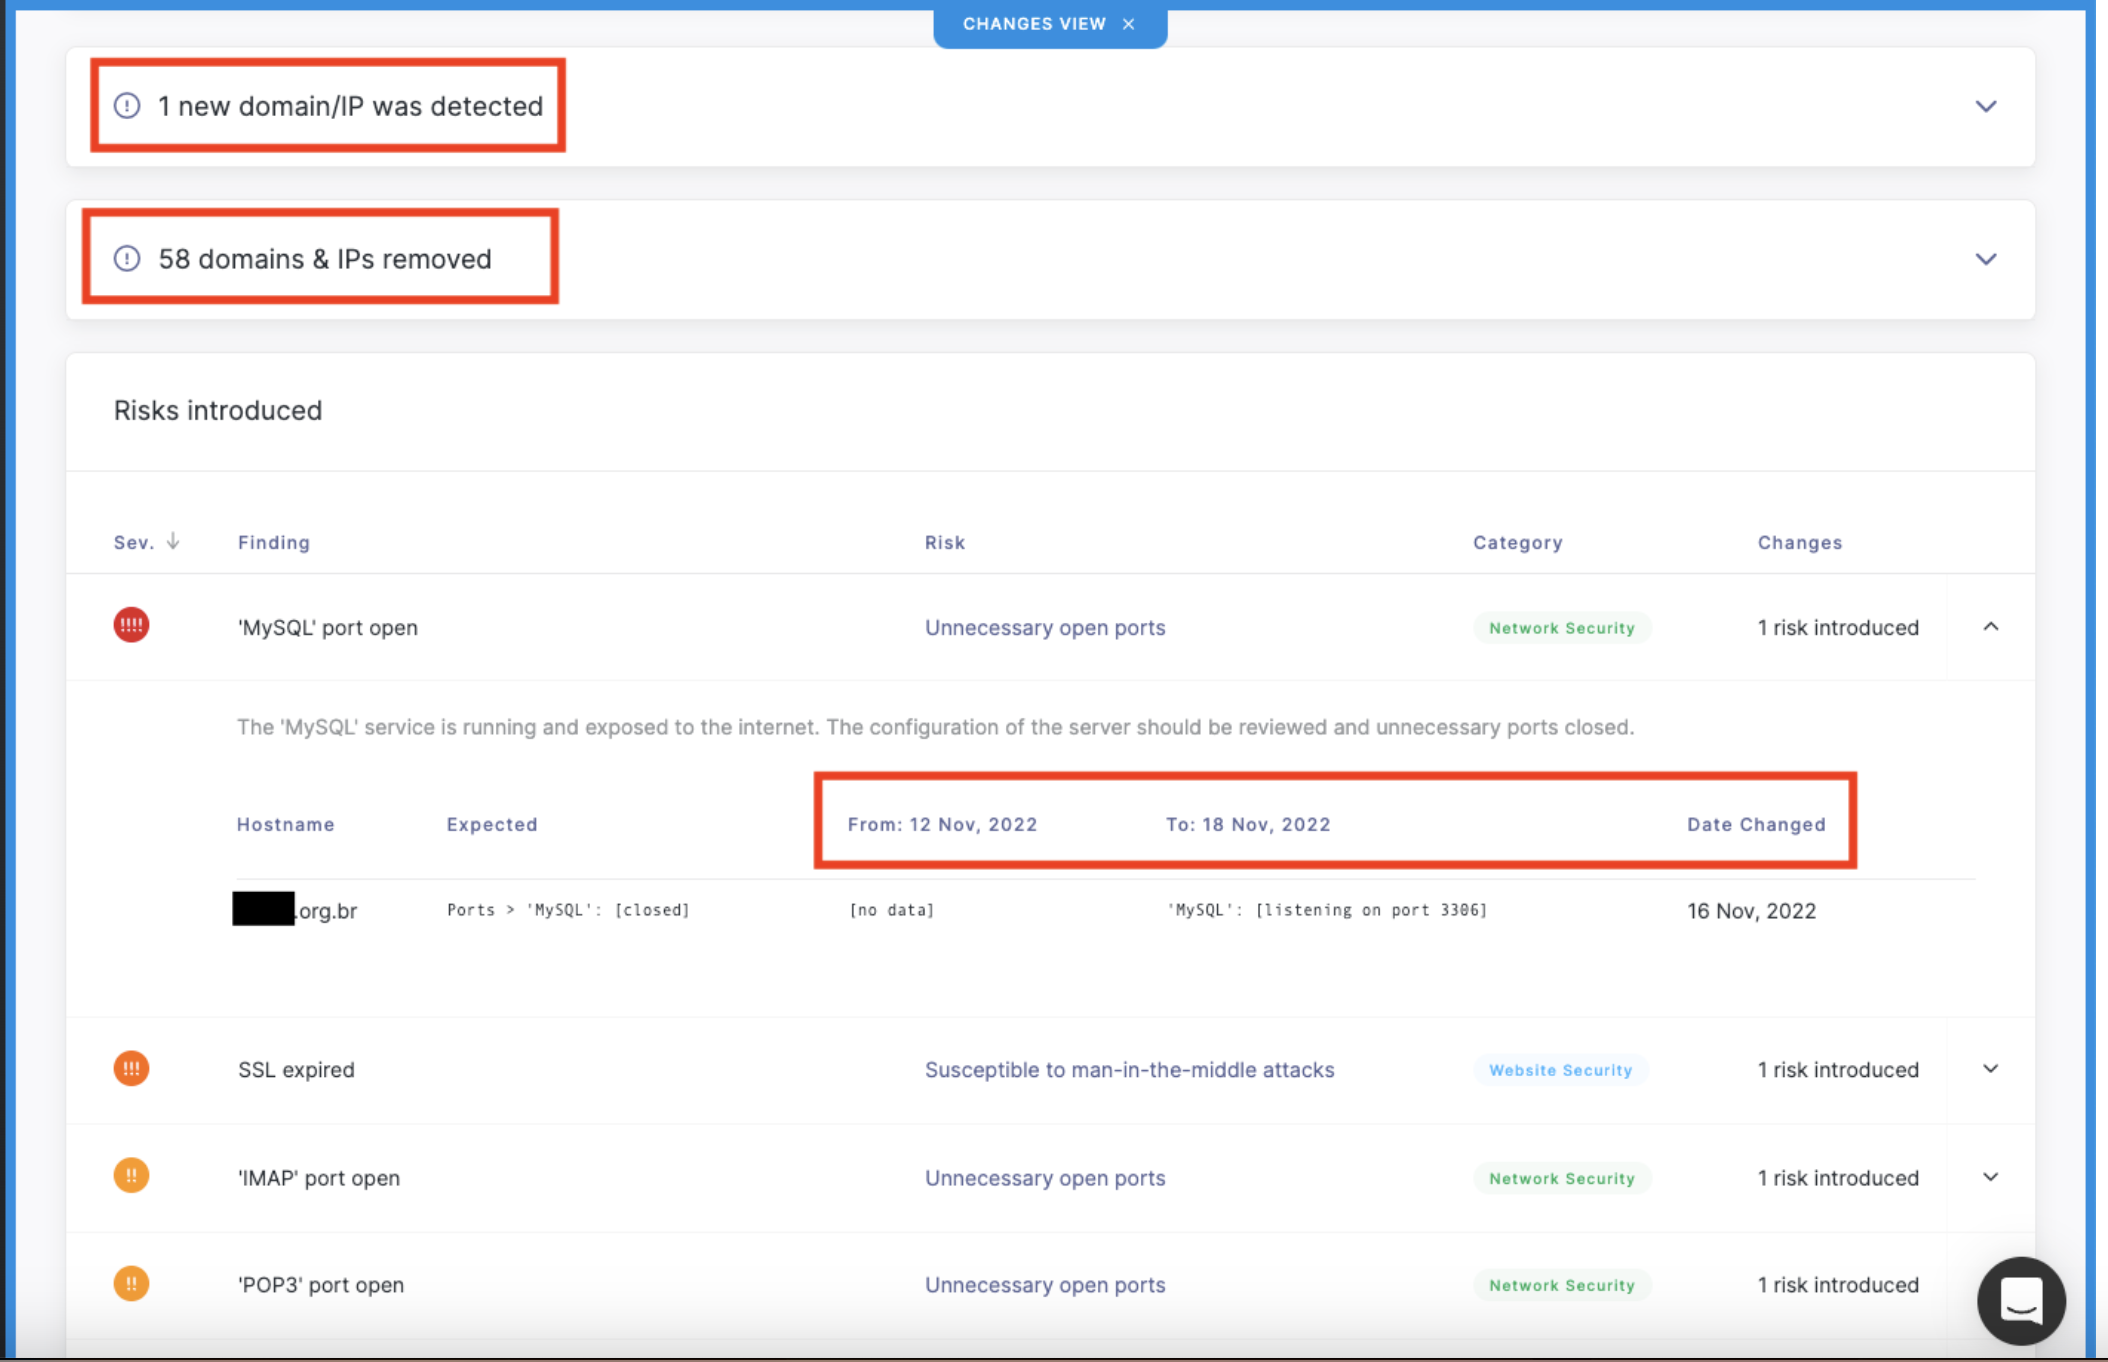
When you scroll down, you'll see the changes grouped into different sections such as:
-
New domains and IPs detected: New domains and IPs that were detected and added to your risk profile along with their security rating.
-
Domains and IPs removed: Domains and IPs that were removed from your risk profile and their security rating.
-
Scoring algorithm changes: A notification that changes were made to our security rating algorithm during the selected period.
-
Risks introduced: The risks introduced over the selected period, the date on which they were detected, their severity, name, risk, category, and the domains that were affected.
-
Risks resolved: The risks that were resolved over the selected period, their risk, category, and domains that were protected.
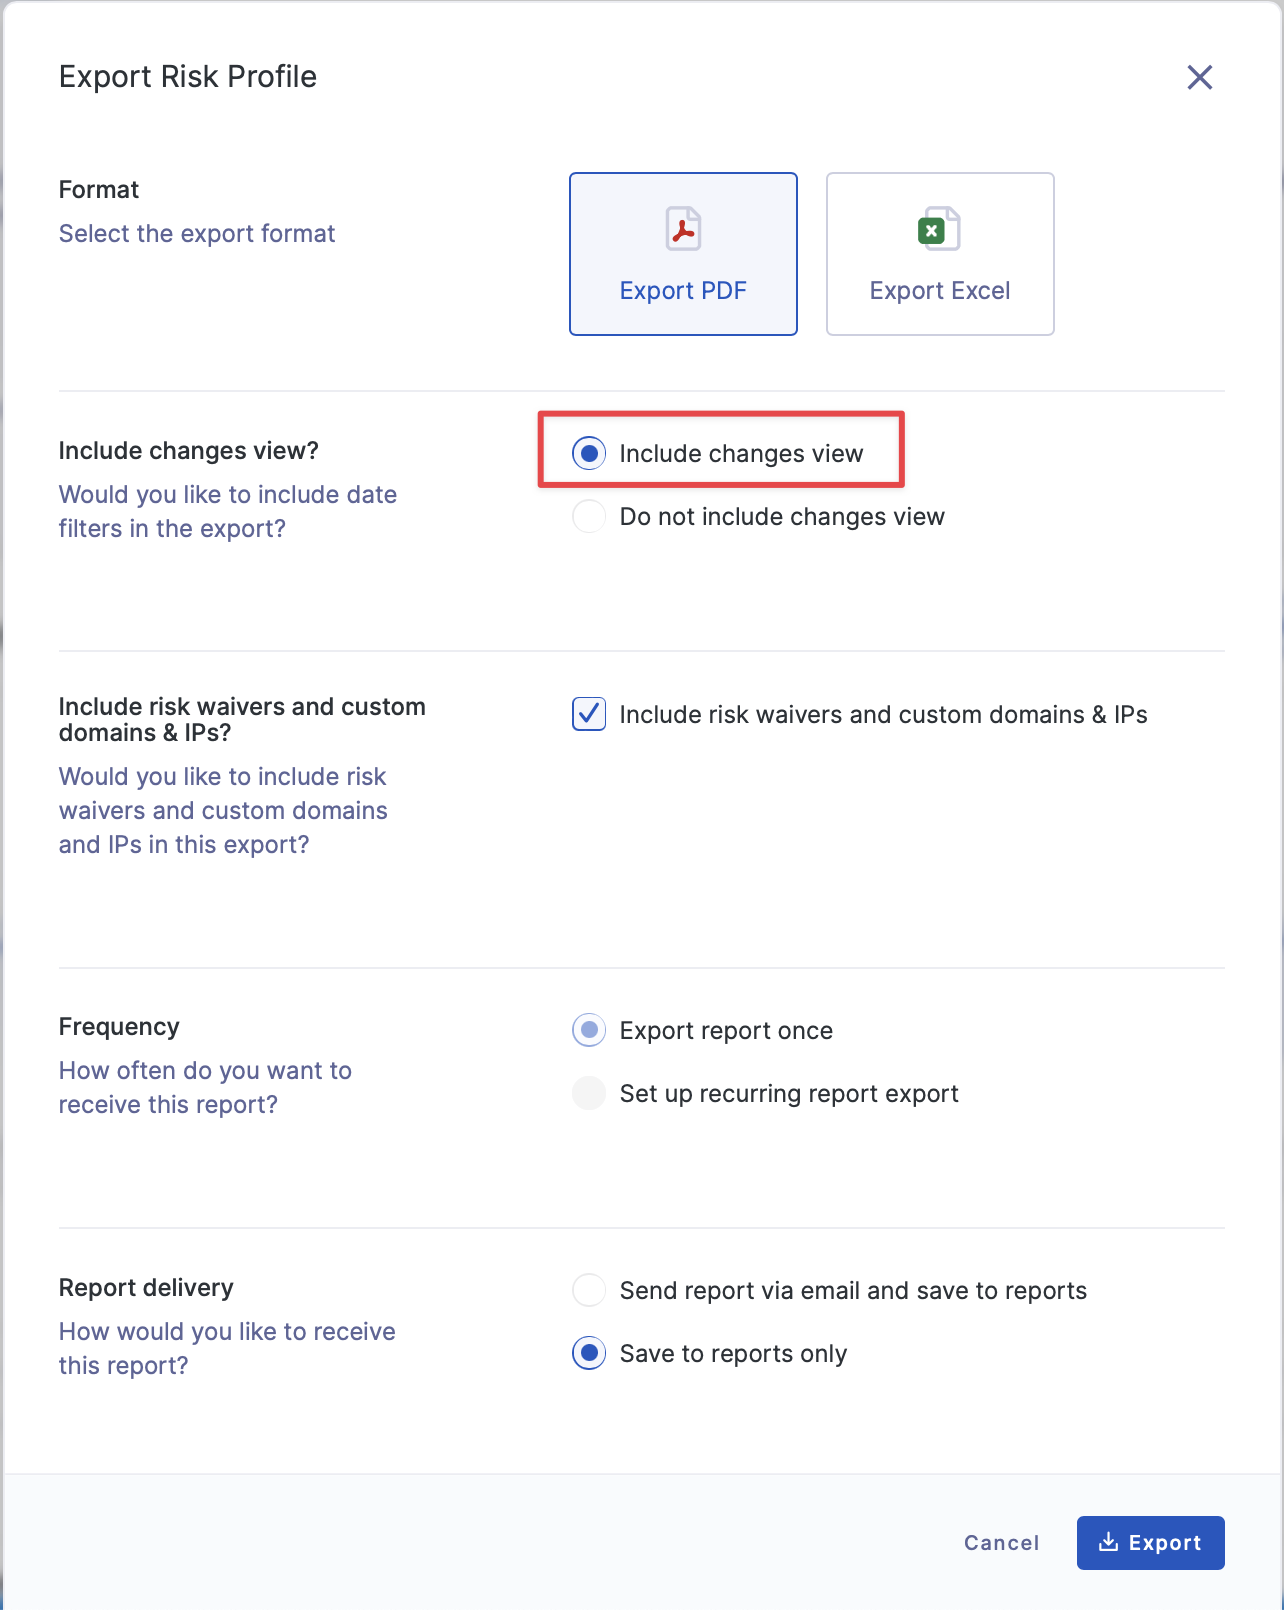
You can export this information in either PDF or Excel format by selecting Export, then Include changes view.
To choose a new timeframe or to exit the changes view, select the X as seen below.
See also